Every year, the Internal Revenue Service announces cost-of-living adjustments that affect contribution limits for retirement plans and various tax deduction, exclusion, exemption, and threshold amounts. Here are a few of the key adjustments for 2024.
Estate, gift, and generation-skipping transfer tax
- The annual gift tax exclusion (and annual generation-skipping transfer tax exclusion) for 2024 is $18,000, up from $17,000 in 2023.
- The gift and estate tax basic exclusion amount (and generation-skipping transfer tax exemption) for 2024 is $13,610,000, up from $12,920,000 in 2023.
Standard deduction
A taxpayer can generally choose to itemize certain deductions or claim a standard deduction on the federal income tax return. In 2024, the standard deduction is:
- $14,600 (up from $13,850 in 2023) for single filers or married individuals filing separate returns
- $29,200 (up from $27,700 in 2023) for married joint filers
- $21,900 (up from $20,800 in 2023) for heads of households
The additional standard deduction amount for the blind and those age 65 or older in 2024 is:
- $1,950 (up from $1,850 in 2023) for single filers and heads of households
- $1,550 (up from $1,500 in 2023) for all other filing statuses
Special rules apply for an individual who can be claimed as a dependent by another taxpayer.
IRAs
The combined annual limit on contributions to traditional and Roth IRAs is $7,000 in 2024 (up from $6,500 in 2023), with individuals age 50 or older able to contribute an additional $1,000. The limit on contributions to a Roth IRA phases out for certain modified adjusted gross income (MAGI) ranges (see table). For individuals who are active participants in an employer-sponsored retirement plan, the deduction for contributions to a traditional IRA also phases out for certain MAGI ranges (see table). The limit on nondeductible contributions to a traditional IRA is not subject to phaseout based on MAGI.
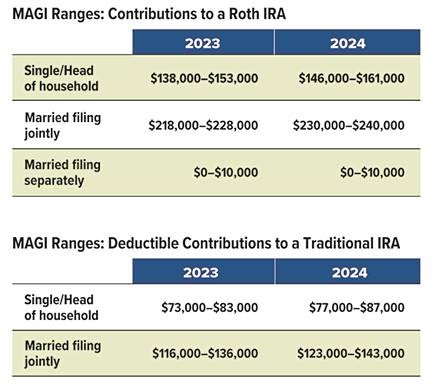
Note: The 2024 phaseout range is $230,000–$240,000 (up from $218,000–$228,000 in 2023) when the individual making the IRA contribution is not covered by a workplace retirement plan but is filing jointly with a spouse who is covered. The phaseout range is $0–$10,000 when the individual is married filing separately and either spouse is covered by a workplace plan.
Employer-sponsored retirement plans
- Employees who participate in 401(k), 403(b), and most 457 plans can defer up to $23,000 in compensation in 2024 (up from $22,500 in 2023); employees age 50 or older can defer up to an additional $7,500 in 2024 (the same as in 2023).
- Employees participating in a SIMPLE retirement plan can defer up to $16,000 in 2024 (up from $15,500 in 2023), and employees age 50 or older can defer up to an additional $3,500 in 2024 (the same as in 2023).
Kiddie tax: child’s unearned income
Under the kiddie tax, a child’s unearned income above $2,600 in 2024 (up from $2,500 in 2023) is taxed using the parents’ tax rates.
IMPORTANT DISCLOSURES
The information presented here is not specific to any individual’s personal circumstances. To the extent that this material concerns tax matters, it is not intended or written to be used, and cannot be used, by a taxpayer for the purpose of avoiding penalties that may be imposed by law. Each taxpayer should seek independent advice from a tax professional based on his or her individual circumstances. These materials are provided for general information and educational purposes based upon publicly available information from sources believed to be reliable—we cannot assure the accuracy or completeness of these materials. The information in these materials may change at any time and without notice.
Securities and investment advice offered through Investment Planners, Inc. (Member FINRA/SIPC) and IPI Wealth Management, Inc., 226 W. Eldorado Street, Decatur, IL 62522. 217-425-6340.